Weather
One in 250-year event underway high in the atmosphere.

For the first time since records began in the mid 20th century , this extended winter period (November to March) is the first in our observational records to see three Sudden Stratospheric Warming (SSW) events. Met Office research suggests the likelihood of having three SSW events in one winter period is just a one in 250-year chance, although it is more likely to happen during an El Niño winter, such as this winter.
The record of SSW events goes back to the 1950s with the introduction of radiosonde balloons which are used to take observations high in the stratosphere on a routine basis. Since then, there has been typically one SSW every two extended winters. However, there are occasional runs of years with no warming events at all e.g. in the 1990s. There are also winters with two warmings such as the winter of 2009/10.
Professor Adam Scaife, Head of Long-Range Forecasting at the Met Office, said: “Although we have not seen it before, we recently documented the chances of an unprecedented three SSW events happening in one winter. Our research work, using multiple computer simulations, showed that this could occur about once in every 250 winters.”
Professor Scaife added, “Although this is very rare, we also found that the chance of multiple SSW events is increased during El Niño and so the chance of multiple events this winter is raised.”
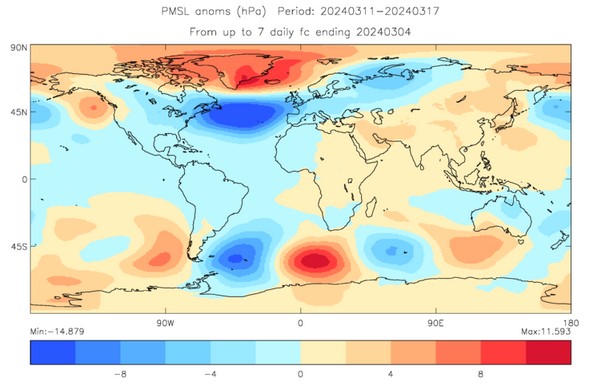
Forecast pressure for mid-March showing relatively high pressure over Iceland and low pressure over mid latitudes (Units: hPa).
A SSW is a disruption of the normal westerly air flow 10 to 50 km above the earth. This often makes the jet stream meander more, which can lead to the development of a large area of high pressure over northern Europe at the Earth’s surface. This can ‘block’ the Atlantic low-pressure systems which are responsible for the relatively mild, wet and windy weather that often occurs in UK winters. This blocking pattern increases the chance of cold, dry weather in the UK and mild, wet and windy conditions for southern Europe. However, the impacts of an SSW do not always equate to cold weather, for example, we have only seen intermittent drops in temperature around the two SSW events early this winter and typically around 70% of events are associated with a cold snap.
SSW is just one of a number of global drivers that can affect weather in the UK, the current SSW is consistent with the latest long-range outlook for March which suggests a continued increased chance of blocked, high-pressure conditions to the north of the UK and a southward shift in the Atlantic jet stream.

It will be no surprise for many to hear that April 2024 has been a wet month. In what has felt like an unsettled spring so far, the UK has had its sixth wettest April since the series began in 1836, according to provisional statistics from the Met Office.
Sunshine has been in short supply, with the UK provisionally recording just 79% of its long-term average for the month.
Wetter than average
The UK experienced 55% more rainfall than an average April, with 111.4mm falling across the month, making it the sixth wettest April in the series and the wettest April since 2012.
Many areas recorded more than their long-term average monthly rainfall, with Scotland experiencing its fourth wettest April in a series which started in 1836. It saw 148.9mm of rainfall across the month – more than 60% of its average and the wettest April since 1947.
Some places in Scotland saw more than double their average rainfall for the month. Edinburgh in particular saw very large rainfall totals, receiving 239% of its average April rainfall, which is its second wettest on record, falling only behind totals in 2000. East and West Lothian, Aberdeen, Clackmannan, Berwickshire and Cumbria, among others, also recorded more than double their average rainfall in the month. A rain-gauge at Honister Pass in the English Lake District recorded more than 400mm of rain.
Met Office Scientist Emily Carlisle said: “April has been a continuation of the past few months: often wet, windy and unsettled. April showers were present from the beginning of the month, with frontal systems bringing persistent precipitation across the UK. Although a high-pressure system moved over the UK on the 20th bringing some drier weather, by the end of the month, low pressure was back in charge, bringing with it more rain.”

Temperatures around average
April was a month of two halves when it comes to temperatures. The month started off warm, particularly along the southeast coast of England. Writtle in Essex recorded 21.8°C, making it the hottest day of 2024 so far in the UK.
Temperatures then dropped, remaining slightly below average for most of the last two weeks of April. This balanced out the warmer temperatures at the start of the month and resulted in a provisional average mean temperature of 8.3°C for the UK, only 0.4°C higher above the 1991-2020 long-term average.
Cloudy conditions often resulted in overnight temperatures being held up, with the average minimum temperature being above average (+0.8°C).


A dull month
Along with being a wet month, April has also been a dull month. The UK provisionally recorded 79% of the long-term average sunshine duration, with 122.9 hours.

One named storm
April saw Storm Kathleen arrive on the 6th, bringing heavy rain to Scotland, Wales, parts of Northern Ireland and the west coast of England. Kathleen also brought strong winds across the UK, with gales along coasts, particularly in the north and west of the UK. Kathleen was the eleventh named storm of the 2023/24 season. This is only the second time that the Met Office has reached the letter K since they began naming storms in 2015.
Spring so far…
Meteorological spring (March to May) so far has been wet. Both England and Wales have already seen more than their long-term average rainfall for the entirety of the season, while the UK has seen 96%. At this point in the season, we’d expect to see 66% of average.
| Provisional April 2024 | Mean temp (°C) | Sunshine (hours) | Rainfall (mm) | |||
| Actual | Diff from avg (°C) | Actual | % of avg | Actual | % of avg | |
| UK | 8.3 | 0.4 | 122.9 | 79 | 111.4 | 155 |
| England | 9.3 | 0.6 | 127.0 | 78 | 85.5 | 152 |
| Wales | 8.5 | 0.4 | 113.3 | 72 | 135.8 | 154 |
| Scotland | 6.6 | 0.0 | 119.2 | 84 | 148.9 | 160 |
| N Ireland | 8.3 | 0.3 | 118.4 | 80 | 104.6 | 141 |

Each year, from June-October, polar climate scientists from the Met Office produce a series of monthly sea ice briefings for the government and the general public. These briefings describe the state of Arctic and Antarctic sea ice, compare how these relate to historic patterns, and, where possible, assess causes of unusual behaviour.
Sea ice is frozen seawater that floats on the surface of the ocean and is found when temperatures are cold enough for sea water to freeze. The extent of sea ice is a key climate indicator, because sea ice cover insulates the ocean in winter and reflects sunlight in summer, as well as providing a habitat for a range of species.

Here, Senior Scientist Alex West talks about the 2023 Antarctic sea ice minimum and its interaction with the ocean and atmosphere.
Lowest sea ice extent on record
Antarctic average sea ice extent for 2023 was the lowest on record. During the ice growth season from June-October, ice extent was exceptionally low for the time of year, reaching over 1 million square km below previous record lows and setting a new record low maximum extent by a very large margin. For much of the rest of the year, the ice was at record or near-record low levels, recording a second successive record low minimum in February (Figure 1).

Figure 1. Antarctic sea ice extent in 2023 (bold black line) with other recent years indicated, as well as earlier years with notably low sea ice extent. The 1981-2010 average is also shown, with the shaded region indicating 2 standard deviation intervals.
The very low extent from June-October was partly caused by enhanced warm northerly winds, associated with persistent areas of high and low pressure (Ionita, 2024). Early in the ice growth season, from May-July, these were concentrated near the Antarctic Peninsula, in the Weddell and Bellingshausen Sea regions; later in the growth season, from August-October, the strongest winds were to be found further west, in the Ross Sea. The position of the lowest sea ice conditions changed similarly.
However, it is likely that the ocean also played a part. The low extent of 2023 continues a pattern of very high variability in Antarctic sea ice since 2007, with first high and then low sea ice conditions persisting for long periods of time, in a way unlikely to be caused by known atmospheric changes (Hobbs et al., 2024). A key moment in this period of high variability was a large reduction that occurred in 2016, and this is thought to be linked to changes in the upper ocean caused by stronger westerly winds mixing warmer waters below towards the surface (Earys et al., 2021; Zhang et al., 2022). Further mixing of warm waters cannot be ruled out as an additional cause of the very low extent of 2023.
The precise contribution of anthropogenic (human-caused) global warming to the record low sea ice of 2023 is not yet known. While climate models predict that Antarctic sea ice extent will decrease in response to anthropogenic warming, variability in the past 15 years has been considerable, with very high extent from 2012-2014 followed by the current period of very low extent (Figure 2). Further extreme variability in either direction remains possible in the years ahead.

Figure 2. Antarctic sea ice monthly anomalies over the period of satellite observations. For each month, the 1981-2010 average ice extent for that month is subtracted. This largely removes the seasonal cycle so that subtler long-term changes can be viewed more easily.
During April we are exploring the topic of the ocean and climate. Follow the #GetClimateReady hashtag on X (formerly Twitter) to learn more throughout the month.
References
Eayrs, C., X. Li, M.N. Raphael and D.M. Holland (2021) Rapid decline in Antarctic sea ice in recent years hints at future change. Nat. Geosci., 14, 460–464. https://doi.org/10.1038/s41561-021-00768-3
Hobbs, W., and Coauthors (2024): Observational Evidence for a Regime Shift in Summer Antarctic Sea Ice. J. Climate, 37, 2263–2275, https://doi.org/10.1175/JCLI-D-23-0479.1
Ionita M (2024) Large-scale drivers of the exceptionally low winter Antarctic sea ice extent in 2023. Front. Earth Sci. 12:1333706, https://doi.org/10.3389/feart.2024.1333706
Zhang, L., T.L. Delworth, X. Yang, F. Zeng, F. Lu, Y. Morioka and M. Bushuk (2022) The relative role of the subsurface Southern Ocean in driving negative Antarctic Sea ice extent anomalies in 2016–2021. Commun. Earth Environ., 3, 302. https://doi.org/10.1038/s43247-022-00624-1

A map of Antarctica showing the Antarctic Peninsula separated by the Bellingshausen and Weddell Seas. Map: Adobe Stock.

A numerical ocean model is a computer programme representing the equations of motion (momentum, conservation of mass and thermodynamics) for the ocean. The model stores each of the physical properties of the ocean (temperatures, salinities and currents) on a three-dimensional grid, writes Ana Aguiar.

Smaller ocean features can be resolved by using a finer grid with more points, but this requires more computational power. The model evolves these physical properties forward in time using its equations of motion. Models of sea ice and biogeochemistry work using similar principles.
Why do we need a numerical ocean model?
We need these models to predict the state of the ocean within short and long timescales for a variety of purposes, ranging from support to operations at sea (for example, search and rescue) to understanding the role of the ocean in the Earth’s climate system. As the ocean sits beneath the atmosphere, sea-surface temperature patterns have widespread impact on the weather over land. Largely because two-thirds of the Earth is covered by ocean and the heat capacity of water considerably outweighs that of the air, the ocean acts as a regulator of the atmosphere.
In polar regions temperatures become cold enough for seawater to freeze and sea ice forms on the surface of the ocean. Sea ice plays an important role in the climate system because it insulates the ocean from the colder atmosphere in winter and, being whiter than the ocean, reflects sunlight in the summer.
The NEMO modelling framework includes a sea-ice model component, known as SI³ (Sea Ice modelling Integrated Initiative). The sea-ice component is run along with the ocean component in a similar manner but using a different set of equations. To understand and prepare for climate change we need to account for the role of the ocean and sea ice.
How is the NEMO model developed?
Nucleus for European Modelling of the Ocean (NEMO) is a state-of-the-art ocean modelling framework. NEMO is developed by a European consortium with the objective of ensuring long-term reliability and sustainability of the code. In other words, the task of maintaining and developing such a complex computer programme requires a well-coordinated team effort, involves tens of developers and hundreds of users.
In the UK there are two member organisations: the Met Office and the National Oceanography Centre (NOC). Met Office Scientific Manager in Ocean Modelling, Ana Aguiar explains: “We work in partnership through the Joint Marine Modelling Programme, contributing to the development of NEMO. The code is publicly available for use in research and commercial applications. It is imperative to reach as many users as possible, to ensure the code gets tested and pushed to the limits of its usability. User requirements then prompt further advances.”
NEMO benefits from continual work to improve its performance (scientific and computational efficiency), to incorporate new scientific and process understanding, and to exploit the increase in supercomputer resources. When the developments are sufficiently mature and can provide significant scientific or technical improvements, a new NEMO version is released. Along with scientific upgrades (which tend to be increasingly computationally demanding), we must deliver code optimisation to make the best use of the available computing resources.
This video presents how NEMO is used by the Copernicus Marine Environment Monitoring Service.
What’s next?
The next NEMO release (expected to be rolled out this summer) will deliver significant improvements to model performance allowing it to run considerably faster. In the long term, among other things, we are also working towards porting the NEMO code to Graphical Processing Units (GPUs) to ensure continuity of the code in future mainstream High Performance Computing architectures
During April we are exploring the topic of the ocean and climate. Follow the #GetClimateReady hashtag on X (formerly Twitter) to learn more throughout the month.

Adwoa Aboah Is Pregnant! Model Reveals She Is Expecting a Baby at 2024 Met Gala

FTX says it has billions more than owed to victims

L.A. college agrees to vote on protesters’ call to divest from Israel

How generative, ChatGPT-like AI is accelerating humanoid robots

Recreational marijuana backers try to overcome rocky history in South Dakota

Women’s World Cup 2027: Fifa to vote to decide hosts

Champions League: Borussia Dortmund confident of final success
Anorexia: The Body Neglected

E-gate outage causing delays across UK airports

Reddit Posts $575 Million Loss Tied to I.P.O. but Also Strong Growth

Black History Facts I had to Learn on My Own pt.6 📜

A Closer Look: Afro-Mexicans 🇲🇽

PROOF AFRICAN AMERICANS AIN'T FROM AFRICA DOCUMENTED EVIDENCE

How Did Normal Medieval People Survive Winter? | Tudor Monastery Farm | Chronicle

The Entire History of Africa in Under 10 Minutes – Documentary

What happened to the many African Kingdoms? History of Africa 1500-1800 Documentary 1/6

AFRO MEXICO: Black History In Mexico!

A Black African King in Medieval European Art

Why do we call them the “Dark Ages”? – Medieval DOCUMENTARY

Blacks Britannica: Diversity in Medieval and Early Modern England

Evidence of African Nobility all over Medieval Europe.

african presence in mexico part 1

Did Africans Discover America Before Christopher Columbus?

The Black Presence in Renaissance Europe in 4K- Historical Paintings of Africans Brought To Life

Africans Visited the Americas Long Before Columbus | African History

Dr. Ivan Van Sertima – African Presence in Early Asia

African Presence in Early Europe – Dr Ivan Sertima – PART 1

History of Cameroon

Black History (It’s Yours) | Black History Month Rap Anthem | Animated Music Video

History of Africa from the 16th to the 20th Century
-
 African History3 months ago
Black History Facts I had to Learn on My Own pt.6 📜
-
 African History4 years ago
A Closer Look: Afro-Mexicans 🇲🇽
-
 African History1 year ago
PROOF AFRICAN AMERICANS AIN'T FROM AFRICA DOCUMENTED EVIDENCE
-
 African History2 years ago
How Did Normal Medieval People Survive Winter? | Tudor Monastery Farm | Chronicle
-
 African History3 years ago
The Entire History of Africa in Under 10 Minutes – Documentary
-
 African History3 years ago
What happened to the many African Kingdoms? History of Africa 1500-1800 Documentary 1/6
-
 African History2 years ago
AFRO MEXICO: Black History In Mexico!
-
 African History1 year ago
A Black African King in Medieval European Art