Our weather is notoriously changeable – that is partly what makes it one of the nation’s talking points. But peering through the statistics a striking pattern emerges: one where the weather oscillates abruptly between different and contrasting phases lasting for a while before the next phase in the sequence begins to dominate.
Let’s look at January’s conditions: the average across the month isn’t headline grabbing. But the pattern back-and-forth between weather types is remarkable.
The year began warm, but within the first five days it had transitioned to a notably cold and dry period. But then, after a further couple of weeks, it transitioned again to a mild and wet spell.
Tapping into warmth
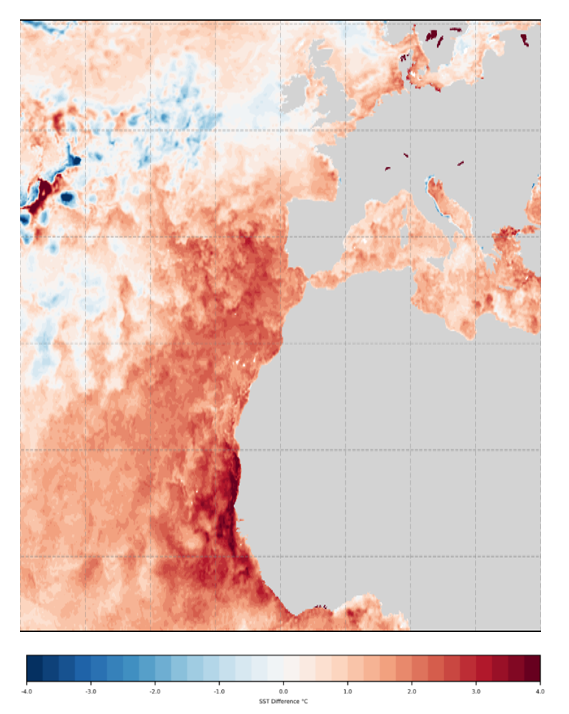
Sea-surface temperature anomalies from the latest OSTIA analysis, 01 February 2024, compared to the European Space Agency Sea Surface Temperature Climate Change Initiative (ESA SST CCI) climatology data. Indicative of the source region for southern UK coming from the maritime heatwave west of NW France and Portugal.
February may turn out to be remarkable on many fronts. Exceptionally mild and wet across a broad swathe of the UK in the first week, with a major change from the end of this week and beyond as very cold air from Scandinavia floods south into the UK.
We can project these extremes onto large-scale weather patterns: with high pressure towards Greenland; low pressure over Scandinavia; and low pressure occasionally stretching across the UK and into continental Europe. This pattern is characteristically described as a block; when the atmosphere gets ‘stuck’ for long periods of time.
Paul Davies is the Met Office’s Principal Meteorologist. He said: “Against this backdrop, the tropical Atlantic is very warm. Sea temperatures off the north-west African coast are currently comparable to values more typical for July.
Winds will continue to tap into this area of warmth, briefly drawing modified air north into southern and western parts of UK. This tropical-sourced air is being forced to rise as it comes up against the blocked pattern and over western hills bringing persistent, locally heavy rain here, and as the air descends to the lee side of these hills it has been introducing very mild and gusty conditions; because of the foehn effect.” This effect – which occurs where air crossing mountains is warmer and drier on the lee side – was also responsible for the record-breaking January temperature in NW Scotland. The weather station at Achfary recorded 19.9°C on 28 January: a new UK daily maximum temperature for January; and a new winter record for Scotland.
Colder conditions ahead
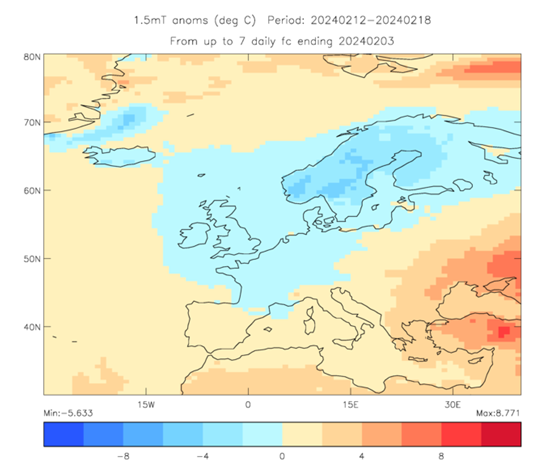
Paul Davies continued: “Then comes the expected change in weather, with winds switching north and drawing very cold air from the Arctic, initially arriving across Scotland, Northern Ireland and Northern England later this week and then heading further south into southern England. This may mean a significant contrast between the recent weekend, and next weekend with spring-like conditions one weekend and the potential for wintry hazards, especially in those regions susceptible to east and northeasterly winds across northern parts of the UK next weekend.”
Temperature anomalies from the latest GloSea forecasts for the week commencing 12 February. It shows cold air over the UK and deep cold residing over Scandinavia. GloSea is the seasonal prediction system developed and run operationally at the Met Office.
The forecasters’ challenges will be to determine:
the exact arrival time of the cold conditions;
and the associated battleground between the cold air in the north, and the mild in the south. This will create a zone of disruptive weather, including heavy rain, snow and ice.
At this stage it’s too early to predict with any confidence the evolving story. But if the boundary pivots and stalls, it could result in snow and blizzards for some. If the cold air digs south more quickly, frost and ice may be the hazards to watch out for; while if the cold air is restricted to the north, the hazards may be rain and strong winds in the south, with snow confined to Scotland, Northern Ireland and Northern England.
Phil Stocker is the chief executive of the National Sheep Association. He said: “The late winter and early spring period can be an extremely concerning time for livestock farmers, particularly those working in the UK’s more exposed and upland areas. Any cold snap, especially if accompanied by significant snowfall, can bring notable hardship to livestock, and of course hill farmers.
“I find it helpful that the Met office is doing more to warn of the risk of bad weather conditions – it gives farmers the chance to assess the risks and do what they can to prepare.”
Paul Davies added: “It’s a close call with only minor wobbles in the weather patterns changing the course of the evolution and associated impact to the UK.”
Through to early March, there is increasing chance of sleet or snow, especially in the north and east of the UK with greater than normal potential for disruptive snow. The specific locations wintry hazards will become clearer as the lead time decreases.
Our advice therefore is to keep abreast with the latest forecasts and warnings.
Warmer weather, flooding, and droughts are already affecting rugby, but how will the increasing effects of climate change impact rugby in the future?
A new report by World Rugby (the rugby union governing body), has identified six major climate risks which could impact the sport, either directly or indirectly, in the future if action is not taken to increase the sport’s resilience against the risks of climate change.
The Climate Change and Rugby report investigated climate hazards across ten countries (Argentina, Australia, England, Fiji, France, India, Japan, New Zealand, South Africa, and the USA), and found there would be significant impacts for each region if global average temperature were to reach levels of +2°C above a pre-industrial level.
The IPCC Sixth Assessment Report (AR6) states that since the Industrial Revolution, the average temperature of the planet has risen by around 1.1°C.
Using a methodology which includes projections alongside observations, research by the Met Office indicates the current global warming level could be as high as 1.25°C. This is a rapid change in terms of our global climate system and is already leading to changes in the extreme weather we experience on the Earth’s surface.
Extreme heat days
As global temperatures rise, so do the instances of extreme heat days (days in which the temperature exceeds 35°C). This not only puts rugby players at risk, but fans of the sport too. This has been seen in other sports in the past where matches have needed to be called off because of scorching temperatures. For example, in 2014, play had to be suspended on all uncovered courts for more than 4 hours at the Australian open due to temperatures rising to over 40°C, causing a risk of heat exhaustion or heatstroke for the athletes.
World Rugby’s report found that six out of the ten countries they investigated would face ten or more additional days each year where playing rugby would be ill advised or even impossible due to climbing temperatures.
Increased frequency and intensity of droughts
Droughts affect the availability of water, and reduced access to this resource could result in drier, harder and less grassy pitches. The report indicates that dry conditions will reduce the quality of playing surfaces, affecting ball bounce and player movement. This could also increase the risk of players getting injured when athletes tumble onto hard ground. Half of all countries in the study would likely see an increase in the frequency and intensity of droughts, leading to less days where pitches are suitable for use.
Marine submersion and flooding risks
The report shows that rising sea levels pose a threat to stadiums near the coast, while flash floods caused by the increased frequency and intensity of rain pose a threat to both coastal pitches and those further inland. Floods could make stadiums inaccessible for extended periods of time, as even after the water subsides, turf and building structures can be left with substantial damage. Repairing stadiums after flooding can be costly and take a long time. World Rugby says that 11% of the 111 stadiums in the report can expect to see an increased annual submersion risk, while eight out of ten countries studied will face an increase in the frequency and intensity of heavy precipitation and flash floods.
Increased humidity
Increased humidity can cause additional heat-related suffering for athletes, officials, and spectators. Higher levels of humidity can make heat feel more intense and reduce the body’s ability to perform certain functions, such as sweating. Additionally, high levels of humidity can cause issues with the health and growth of certain grass varieties that may be used on pitches. The report found that most climate regions will experience periods of higher humidity, impacting the ability to play rugby.
Adaptation
To reduce the impacts of climate change on rugby, some adaptations will need to be made in the future. World Rugby has suggested in their report the development and implementation of individual sustainability plans, to help reduce rugby’s environmental impact. As well as this, climate projections will need to be considered when implementing new policies to prepare the game for a changing climate.
In a recent blog, we shared details of a piece of work by the Met Office which explores expected future climatic conditions for a range of range of cultural, sporting and social events across the UK. The study compares observations and climate projections for temperature and rainfall may change in the future for the start of the Six Nations (February) at the Twickenham (London), Murrayfield (Edinburgh) and Principality (Cardiff) stadiums.
Climate change already has, and will likely continue to affect rugby, but with research and the implementation of new strategies and adaptation, risks can be minimised to allow fans and athletes to continue to enjoy the sport.
The Met Office has just published its latest briefing on Arctic and Antarctic sea ice.
The update doesn’t reveal any record-breaking figures, but it does reveal that sea ice loss remains a serious issue.
Alex West who co-ordinates the sea ice briefings said: “After last year’s record-breaking minimum extent of sea ice in the Antarctic, the latest update shows greater sea ice extent than last year, but it is still the second lowest on record for the time of year.
Following a warm June, Arctic sea ice extent is below average for the time of year but some way above record low levels, with conditions fairly typical of recent years.
“Extent is particularly low in the Laptev Sea and in the Atlantic sector, but nearer average in other parts of the Arctic.
“This year’s September Arctic sea ice extent is likely to be well below average, but there are not yet heightened indications of a new record low.”
The Advancing Arctic Capabilities programme – a new project led by the Met Office -brings international partners to develop an improved understanding of what is happening to the region’s ice, ocean and atmosphere to support global climate resilience.
The project will deliver cutting-edge insights into Arctic weather patterns and ocean currents.
Hurricane Beryl, which has been tearing through the Caribbean, has been hitting the headlines for several reasons.
Firstly, there is the undeniable fact that during her existence as a Category 4 and 5 hurricane Beryl caused much damage and loss of life across several nations and territories, including Grenada, St Vincent and the Grenadines, Jamaica and the British Overseas Territory of the Cayman Islands.
Satellite image of Hurricane Beryl crossing Jamaica in early July 2024
Secondly, Beryl has become infamous for being the earliest Category 5 hurricane in the historical record in the Atlantic Basin. Category 5 is the highest ranking for hurricanes requiring sustained wind speeds of at least 157 mph. Hurricane Beryl’s wind actually peaked at 165 mph on 2 July. The earliest date in the year any previous Atlantic hurricane had achieved winds of this strength was a full month later on 5 August.
Active hurricane season
Julian Heming is a Met Office tropical cyclone expert who has been studying these systems for many years. He said: “In the second half of May several prediction centres, including the Met Office, forecast an active Atlantic hurricane season with between 150% and 200% of usual activity.
“These Atlantic seasonal forecasts have been influenced by the development of cooler waters in the equatorial eastern Pacific in recent months – in line with the anticipated La Niña or cooler phase of the naturally-variable El Niño Southern Oscillation (ENSO) cycle.
“Developing La Niña conditions have a known association with a more active Atlantic hurricane season. So, we know that natural variation in the climate system has a huge observable effect on hurricane activity.
“But this trend towards La Niña favouring hurricane development would not solely explain Hurricane Beryl and the prediction of an active hurricane season.
“Sea temperatures across the tropical Atlantic and Caribbean Sea have been well above average since the Spring of 2023 which provides fuel for intense hurricanes like Beryl. There is much meteorologists do not yet understand about how these high sea-surface temperatures have developed and why they have persisted for so long. This is an active area of research.”
“Furthermore, higher sea-surface temperatures in line with a warming climate are expected to favour the development of a greater proportion of intense tropical cyclones in the long term.”
International effort
Will Lang is the Met Office’s head of Situational Awareness. He said: “Met Office forecasts are a crucial part of the international effort to predict Atlantic hurricanes, and our experts work at the heart of UK Government’s international response to damaging hurricanes such as Beryl.”
You can watch an interview about Hurricane Beryl here.