Weather
Our changing weather patterns: a tale of abrupt transitions
Our weather is notoriously changeable – that is partly what makes it one of the nation’s talking points. But peering through the statistics a striking pattern emerges: one where the weather oscillates abruptly between different and contrasting phases lasting for a while before the next phase in the sequence begins to dominate.
Let’s look at January’s conditions: the average across the month isn’t headline grabbing. But the pattern back-and-forth between weather types is remarkable.

The year began warm, but within the first five days it had transitioned to a notably cold and dry period. But then, after a further couple of weeks, it transitioned again to a mild and wet spell.
Tapping into warmth
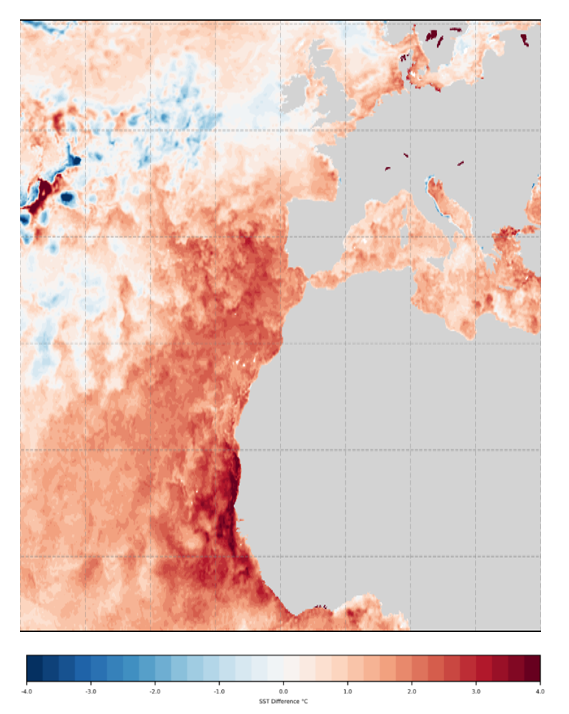
Sea-surface temperature anomalies from the latest OSTIA analysis, 01 February 2024, compared to the European Space Agency Sea Surface Temperature Climate Change Initiative (ESA SST CCI) climatology data. Indicative of the source region for southern UK coming from the maritime heatwave west of NW France and Portugal.
February may turn out to be remarkable on many fronts. Exceptionally mild and wet across a broad swathe of the UK in the first week, with a major change from the end of this week and beyond as very cold air from Scandinavia floods south into the UK.
We can project these extremes onto large-scale weather patterns: with high pressure towards Greenland; low pressure over Scandinavia; and low pressure occasionally stretching across the UK and into continental Europe. This pattern is characteristically described as a block; when the atmosphere gets ‘stuck’ for long periods of time.
Paul Davies is the Met Office’s Principal Meteorologist. He said: “Against this backdrop, the tropical Atlantic is very warm. Sea temperatures off the north-west African coast are currently comparable to values more typical for July.
Winds will continue to tap into this area of warmth, briefly drawing modified air north into southern and western parts of UK. This tropical-sourced air is being forced to rise as it comes up against the blocked pattern and over western hills bringing persistent, locally heavy rain here, and as the air descends to the lee side of these hills it has been introducing very mild and gusty conditions; because of the foehn effect.” This effect – which occurs where air crossing mountains is warmer and drier on the lee side – was also responsible for the record-breaking January temperature in NW Scotland. The weather station at Achfary recorded 19.9°C on 28 January: a new UK daily maximum temperature for January; and a new winter record for Scotland.
Colder conditions ahead
Paul Davies continued: “Then comes the expected change in weather, with winds switching north and drawing very cold air from the Arctic, initially arriving across Scotland, Northern Ireland and Northern England later this week and then heading further south into southern England. This may mean a significant contrast between the recent weekend, and next weekend with spring-like conditions one weekend and the potential for wintry hazards, especially in those regions susceptible to east and northeasterly winds across northern parts of the UK next weekend.”

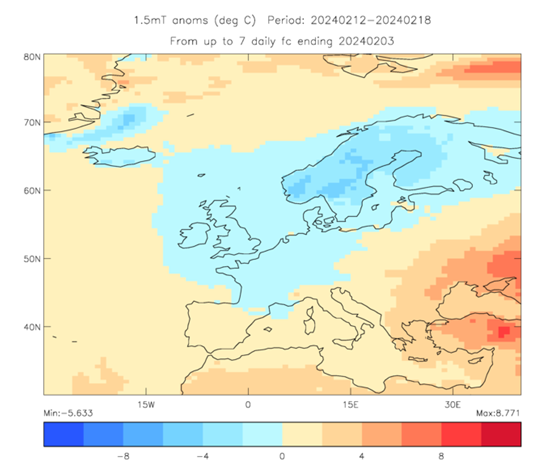
Temperature anomalies from the latest GloSea forecasts for the week commencing 12 February. It shows cold air over the UK and deep cold residing over Scandinavia. GloSea is the seasonal prediction system developed and run operationally at the Met Office.
The forecasters’ challenges will be to determine:
- the exact arrival time of the cold conditions;
- and the associated battleground between the cold air in the north, and the mild in the south. This will create a zone of disruptive weather, including heavy rain, snow and ice.
At this stage it’s too early to predict with any confidence the evolving story. But if the boundary pivots and stalls, it could result in snow and blizzards for some. If the cold air digs south more quickly, frost and ice may be the hazards to watch out for; while if the cold air is restricted to the north, the hazards may be rain and strong winds in the south, with snow confined to Scotland, Northern Ireland and Northern England.
Phil Stocker is the chief executive of the National Sheep Association. He said: “The late winter and early spring period can be an extremely concerning time for livestock farmers, particularly those working in the UK’s more exposed and upland areas. Any cold snap, especially if accompanied by significant snowfall, can bring notable hardship to livestock, and of course hill farmers.
“I find it helpful that the Met office is doing more to warn of the risk of bad weather conditions – it gives farmers the chance to assess the risks and do what they can to prepare.”
Paul Davies added: “It’s a close call with only minor wobbles in the weather patterns changing the course of the evolution and associated impact to the UK.”
Through to early March, there is increasing chance of sleet or snow, especially in the north and east of the UK with greater than normal potential for disruptive snow. The specific locations wintry hazards will become clearer as the lead time decreases.
Our advice therefore is to keep abreast with the latest forecasts and warnings.

It will be no surprise for many to hear that April 2024 has been a wet month. In what has felt like an unsettled spring so far, the UK has had its sixth wettest April since the series began in 1836, according to provisional statistics from the Met Office.
Sunshine has been in short supply, with the UK provisionally recording just 79% of its long-term average for the month.
Wetter than average
The UK experienced 55% more rainfall than an average April, with 111.4mm falling across the month, making it the sixth wettest April in the series and the wettest April since 2012.
Many areas recorded more than their long-term average monthly rainfall, with Scotland experiencing its fourth wettest April in a series which started in 1836. It saw 148.9mm of rainfall across the month – more than 60% of its average and the wettest April since 1947.
Some places in Scotland saw more than double their average rainfall for the month. Edinburgh in particular saw very large rainfall totals, receiving 239% of its average April rainfall, which is its second wettest on record, falling only behind totals in 2000. East and West Lothian, Aberdeen, Clackmannan, Berwickshire and Cumbria, among others, also recorded more than double their average rainfall in the month. A rain-gauge at Honister Pass in the English Lake District recorded more than 400mm of rain.
Met Office Scientist Emily Carlisle said: “April has been a continuation of the past few months: often wet, windy and unsettled. April showers were present from the beginning of the month, with frontal systems bringing persistent precipitation across the UK. Although a high-pressure system moved over the UK on the 20th bringing some drier weather, by the end of the month, low pressure was back in charge, bringing with it more rain.”

Temperatures around average
April was a month of two halves when it comes to temperatures. The month started off warm, particularly along the southeast coast of England. Writtle in Essex recorded 21.8°C, making it the hottest day of 2024 so far in the UK.
Temperatures then dropped, remaining slightly below average for most of the last two weeks of April. This balanced out the warmer temperatures at the start of the month and resulted in a provisional average mean temperature of 8.3°C for the UK, only 0.4°C higher above the 1991-2020 long-term average.
Cloudy conditions often resulted in overnight temperatures being held up, with the average minimum temperature being above average (+0.8°C).


A dull month
Along with being a wet month, April has also been a dull month. The UK provisionally recorded 79% of the long-term average sunshine duration, with 122.9 hours.

One named storm
April saw Storm Kathleen arrive on the 6th, bringing heavy rain to Scotland, Wales, parts of Northern Ireland and the west coast of England. Kathleen also brought strong winds across the UK, with gales along coasts, particularly in the north and west of the UK. Kathleen was the eleventh named storm of the 2023/24 season. This is only the second time that the Met Office has reached the letter K since they began naming storms in 2015.
Spring so far…
Meteorological spring (March to May) so far has been wet. Both England and Wales have already seen more than their long-term average rainfall for the entirety of the season, while the UK has seen 96%. At this point in the season, we’d expect to see 66% of average.
| Provisional April 2024 | Mean temp (°C) | Sunshine (hours) | Rainfall (mm) | |||
| Actual | Diff from avg (°C) | Actual | % of avg | Actual | % of avg | |
| UK | 8.3 | 0.4 | 122.9 | 79 | 111.4 | 155 |
| England | 9.3 | 0.6 | 127.0 | 78 | 85.5 | 152 |
| Wales | 8.5 | 0.4 | 113.3 | 72 | 135.8 | 154 |
| Scotland | 6.6 | 0.0 | 119.2 | 84 | 148.9 | 160 |
| N Ireland | 8.3 | 0.3 | 118.4 | 80 | 104.6 | 141 |

Each year, from June-October, polar climate scientists from the Met Office produce a series of monthly sea ice briefings for the government and the general public. These briefings describe the state of Arctic and Antarctic sea ice, compare how these relate to historic patterns, and, where possible, assess causes of unusual behaviour.
Sea ice is frozen seawater that floats on the surface of the ocean and is found when temperatures are cold enough for sea water to freeze. The extent of sea ice is a key climate indicator, because sea ice cover insulates the ocean in winter and reflects sunlight in summer, as well as providing a habitat for a range of species.

Here, Senior Scientist Alex West talks about the 2023 Antarctic sea ice minimum and its interaction with the ocean and atmosphere.
Lowest sea ice extent on record
Antarctic average sea ice extent for 2023 was the lowest on record. During the ice growth season from June-October, ice extent was exceptionally low for the time of year, reaching over 1 million square km below previous record lows and setting a new record low maximum extent by a very large margin. For much of the rest of the year, the ice was at record or near-record low levels, recording a second successive record low minimum in February (Figure 1).

Figure 1. Antarctic sea ice extent in 2023 (bold black line) with other recent years indicated, as well as earlier years with notably low sea ice extent. The 1981-2010 average is also shown, with the shaded region indicating 2 standard deviation intervals.
The very low extent from June-October was partly caused by enhanced warm northerly winds, associated with persistent areas of high and low pressure (Ionita, 2024). Early in the ice growth season, from May-July, these were concentrated near the Antarctic Peninsula, in the Weddell and Bellingshausen Sea regions; later in the growth season, from August-October, the strongest winds were to be found further west, in the Ross Sea. The position of the lowest sea ice conditions changed similarly.
However, it is likely that the ocean also played a part. The low extent of 2023 continues a pattern of very high variability in Antarctic sea ice since 2007, with first high and then low sea ice conditions persisting for long periods of time, in a way unlikely to be caused by known atmospheric changes (Hobbs et al., 2024). A key moment in this period of high variability was a large reduction that occurred in 2016, and this is thought to be linked to changes in the upper ocean caused by stronger westerly winds mixing warmer waters below towards the surface (Earys et al., 2021; Zhang et al., 2022). Further mixing of warm waters cannot be ruled out as an additional cause of the very low extent of 2023.
The precise contribution of anthropogenic (human-caused) global warming to the record low sea ice of 2023 is not yet known. While climate models predict that Antarctic sea ice extent will decrease in response to anthropogenic warming, variability in the past 15 years has been considerable, with very high extent from 2012-2014 followed by the current period of very low extent (Figure 2). Further extreme variability in either direction remains possible in the years ahead.

Figure 2. Antarctic sea ice monthly anomalies over the period of satellite observations. For each month, the 1981-2010 average ice extent for that month is subtracted. This largely removes the seasonal cycle so that subtler long-term changes can be viewed more easily.
During April we are exploring the topic of the ocean and climate. Follow the #GetClimateReady hashtag on X (formerly Twitter) to learn more throughout the month.
References
Eayrs, C., X. Li, M.N. Raphael and D.M. Holland (2021) Rapid decline in Antarctic sea ice in recent years hints at future change. Nat. Geosci., 14, 460–464. https://doi.org/10.1038/s41561-021-00768-3
Hobbs, W., and Coauthors (2024): Observational Evidence for a Regime Shift in Summer Antarctic Sea Ice. J. Climate, 37, 2263–2275, https://doi.org/10.1175/JCLI-D-23-0479.1
Ionita M (2024) Large-scale drivers of the exceptionally low winter Antarctic sea ice extent in 2023. Front. Earth Sci. 12:1333706, https://doi.org/10.3389/feart.2024.1333706
Zhang, L., T.L. Delworth, X. Yang, F. Zeng, F. Lu, Y. Morioka and M. Bushuk (2022) The relative role of the subsurface Southern Ocean in driving negative Antarctic Sea ice extent anomalies in 2016–2021. Commun. Earth Environ., 3, 302. https://doi.org/10.1038/s43247-022-00624-1

A map of Antarctica showing the Antarctic Peninsula separated by the Bellingshausen and Weddell Seas. Map: Adobe Stock.

A numerical ocean model is a computer programme representing the equations of motion (momentum, conservation of mass and thermodynamics) for the ocean. The model stores each of the physical properties of the ocean (temperatures, salinities and currents) on a three-dimensional grid, writes Ana Aguiar.

Smaller ocean features can be resolved by using a finer grid with more points, but this requires more computational power. The model evolves these physical properties forward in time using its equations of motion. Models of sea ice and biogeochemistry work using similar principles.
Why do we need a numerical ocean model?
We need these models to predict the state of the ocean within short and long timescales for a variety of purposes, ranging from support to operations at sea (for example, search and rescue) to understanding the role of the ocean in the Earth’s climate system. As the ocean sits beneath the atmosphere, sea-surface temperature patterns have widespread impact on the weather over land. Largely because two-thirds of the Earth is covered by ocean and the heat capacity of water considerably outweighs that of the air, the ocean acts as a regulator of the atmosphere.
In polar regions temperatures become cold enough for seawater to freeze and sea ice forms on the surface of the ocean. Sea ice plays an important role in the climate system because it insulates the ocean from the colder atmosphere in winter and, being whiter than the ocean, reflects sunlight in the summer.
The NEMO modelling framework includes a sea-ice model component, known as SI³ (Sea Ice modelling Integrated Initiative). The sea-ice component is run along with the ocean component in a similar manner but using a different set of equations. To understand and prepare for climate change we need to account for the role of the ocean and sea ice.
How is the NEMO model developed?
Nucleus for European Modelling of the Ocean (NEMO) is a state-of-the-art ocean modelling framework. NEMO is developed by a European consortium with the objective of ensuring long-term reliability and sustainability of the code. In other words, the task of maintaining and developing such a complex computer programme requires a well-coordinated team effort, involves tens of developers and hundreds of users.
In the UK there are two member organisations: the Met Office and the National Oceanography Centre (NOC). Met Office Scientific Manager in Ocean Modelling, Ana Aguiar explains: “We work in partnership through the Joint Marine Modelling Programme, contributing to the development of NEMO. The code is publicly available for use in research and commercial applications. It is imperative to reach as many users as possible, to ensure the code gets tested and pushed to the limits of its usability. User requirements then prompt further advances.”
NEMO benefits from continual work to improve its performance (scientific and computational efficiency), to incorporate new scientific and process understanding, and to exploit the increase in supercomputer resources. When the developments are sufficiently mature and can provide significant scientific or technical improvements, a new NEMO version is released. Along with scientific upgrades (which tend to be increasingly computationally demanding), we must deliver code optimisation to make the best use of the available computing resources.
This video presents how NEMO is used by the Copernicus Marine Environment Monitoring Service.
What’s next?
The next NEMO release (expected to be rolled out this summer) will deliver significant improvements to model performance allowing it to run considerably faster. In the long term, among other things, we are also working towards porting the NEMO code to Graphical Processing Units (GPUs) to ensure continuity of the code in future mainstream High Performance Computing architectures
During April we are exploring the topic of the ocean and climate. Follow the #GetClimateReady hashtag on X (formerly Twitter) to learn more throughout the month.

7 Spring Shoes I’ve Been Loving Lately as a Fashion Writer

Bayer Leverkusen: Will Xabi Alonso’s side win an Invincible Treble?

Arrest at Will Smith’s home. Chris Pine on no Wonder Woman 3. Bette Midler regrets not suing Lohan.

Artificially Intelligent Help for Planning Your Summer Vacation

Gutfeld: Team Biden is lying to the American people to imprison its chief rival

Taking Racism out of the Kidney Disease Equation

Biden Says the U.S. Will Not Supply Israel With Weapons to Attack Rafah

Disney and Warner to bundle streaming services

Tom Selleck on Being Discovered From The Dating Game and Hollywood Memories With Farrah Fawcett

MLB star Ohtani's ex-interpreter to plead guilty to fraud

Black History Facts I had to Learn on My Own pt.6 📜

A Closer Look: Afro-Mexicans 🇲🇽

PROOF AFRICAN AMERICANS AIN'T FROM AFRICA DOCUMENTED EVIDENCE

How Did Normal Medieval People Survive Winter? | Tudor Monastery Farm | Chronicle

The Entire History of Africa in Under 10 Minutes – Documentary

What happened to the many African Kingdoms? History of Africa 1500-1800 Documentary 1/6

AFRO MEXICO: Black History In Mexico!

A Black African King in Medieval European Art

Why do we call them the “Dark Ages”? – Medieval DOCUMENTARY

Mr Incredible Becoming Canny/Uncanny Mapping (You live in Paraguay 🇵🇾)

Evidence of African Nobility all over Medieval Europe.

african presence in mexico part 1

Did Africans Discover America Before Christopher Columbus?

The Black Presence in Renaissance Europe in 4K- Historical Paintings of Africans Brought To Life

Africans Visited the Americas Long Before Columbus | African History

Dr. Ivan Van Sertima – African Presence in Early Asia

African Presence in Early Europe – Dr Ivan Sertima – PART 1

History of Cameroon

Black History (It’s Yours) | Black History Month Rap Anthem | Animated Music Video

History of Africa from the 16th to the 20th Century
-
 African History3 months ago
Black History Facts I had to Learn on My Own pt.6 📜
-
 African History4 years ago
A Closer Look: Afro-Mexicans 🇲🇽
-
 African History1 year ago
PROOF AFRICAN AMERICANS AIN'T FROM AFRICA DOCUMENTED EVIDENCE
-
 African History2 years ago
How Did Normal Medieval People Survive Winter? | Tudor Monastery Farm | Chronicle
-
 African History3 years ago
The Entire History of Africa in Under 10 Minutes – Documentary
-
 African History3 years ago
What happened to the many African Kingdoms? History of Africa 1500-1800 Documentary 1/6
-
 African History2 years ago
AFRO MEXICO: Black History In Mexico!
-
 African History1 year ago
A Black African King in Medieval European Art