As shared in our recent blog post on understanding weather and climate extremes, we are seeing an increase of extreme weather around the world including in the UK. Since the industrial revolution, the average temperature of the planet has risen by around 1.26 °C (based on the suggested approach of Met Office researchers). This is a rapid change in terms of our global climate system and has already led to the changes in the extreme weather we are experiencing.
The Met Office’s dedicated team looking at weather and climate extremes has collated the latest published academic literature on severe weather in the UK in the context of our changing climate. In this blog post, Climate Extremes Principal Fellow and Chief Meteorologist Paul Davies shares some of the findings from that work.
Extreme heat
The frequency and intensity of heatwaves have increased worldwide. A number of major heatwaves in the UK have occurred in the past 5 years (2018, 2019, 2021 and 2022), each seeing new temperature records set. Notably the England record has been set three times over. Numerous climate attribution studies have shown that human influences have increased the chances of occurrence of specific extreme heat events such as the summer of 2018 and July 2022. Almost all studies on extreme heat events indicate human influence.
Looking ahead, the headline findings from UK Climate Projections (UKCP) indicate that on average, summers will become hotter. Met Office UKCP Local projections indicate that hot spells will become more frequent in our future climate, particularly over the south-east of the UK, with temperatures projected to rise in all seasons.
Heavy rainfall
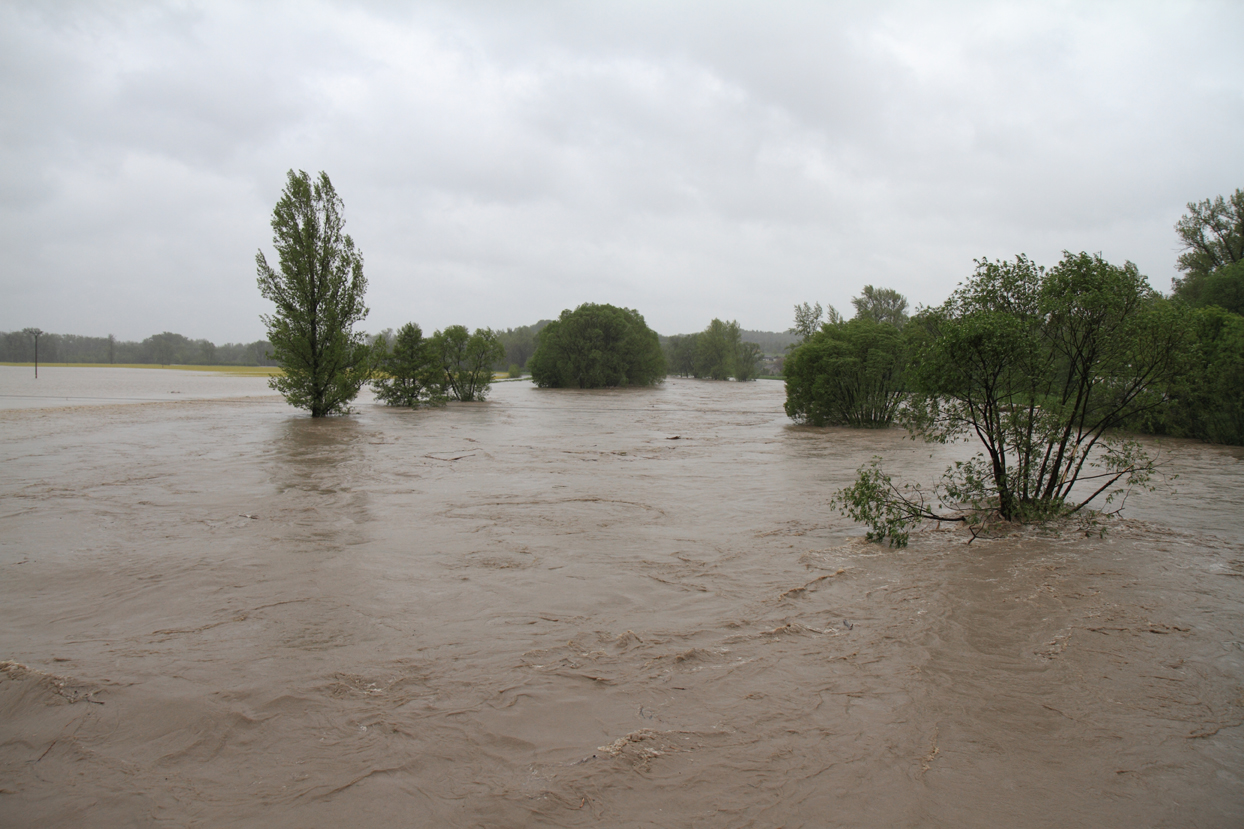
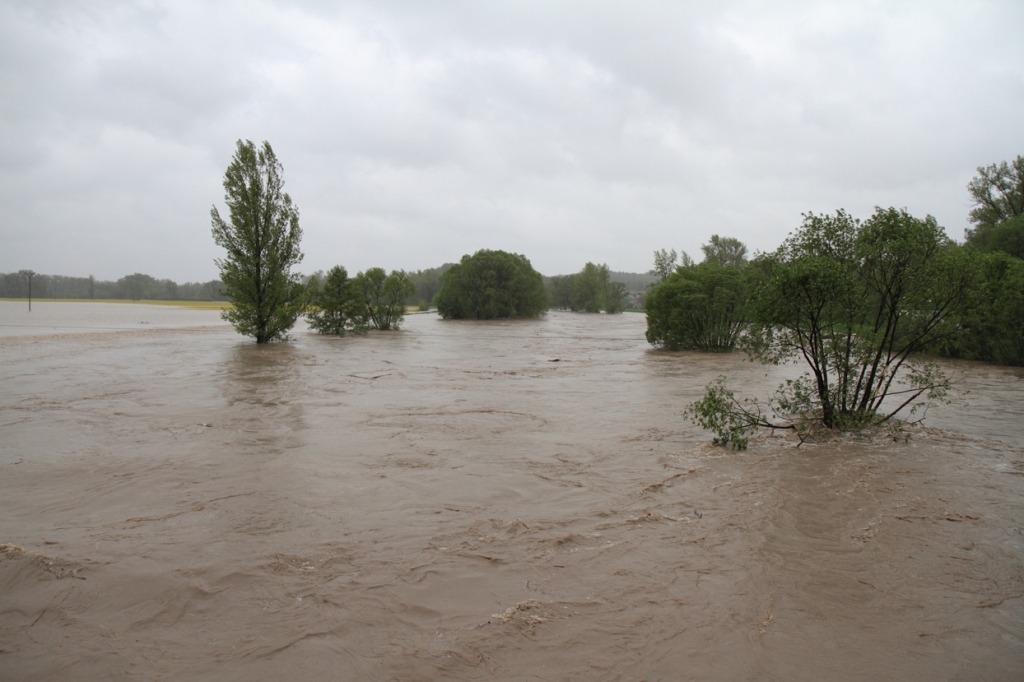
In the recent climate, it has generally become wetter, particularly during winter. The winters of 2014, 2016 and 2020 are all in the top five wettest (the other winters being 1995 and 1990). One reason for this is the large annual, seasonal and decadal variability in rainfall, but in winter the emerging climate change signal resulting from increased atmospheric moisture is an important secondary factor. Rainfall totals on the wettest days have increased, this is more strongly linked to climate change.
In the future, climate projections for the UK indicate there being a greater risk of heavy precipitation and prolonged events in the future, particularly during winter.
As the atmosphere warms due to human induced climate change it can hold more moisture, at a rate of around 7% more moisture for every degree of warming. This means that when it does rain it can be more intense. On a simple level, this explains why in many regions of the world projections show an increase in precipitation as a consequence of human induced climate change.
Intense rainfall from thunderstorms
In the recent climate, trends in short rainfall events lasting less that one day are difficult to detect, due to historically sparse sub-daily observations and natural year-to-year and decade-to-decade variability. Extreme precipitation associated with thunderstorms, is, however, projected to intensify with climate change.
In the future, rainfall events exceeding 20mm per hour, which can cause flash flooding, are expected to be four times as frequent by the 2070s compared to the 1980s, under a high emissions scenario i.e., if greenhouse gas emissions continue unabated at a high level. Changes are not projected to happen gradually, but instead extreme years with lots of events could tend to cluster. When and by how much these changes are projected to occur varies in different regions of the UK.
Windstorms
In the recent climate, there is no evidence of positive or negative trends in windstorm number or intensity over the UK. Trends in windstorm numbers are difficult to detect, due to how these naturally vary year-to-year and decade-to-decade. As well as wind damage, windstorms can cause impacts from storm surges and high waves in coastal areas. These are expected to worsen as sea level rises.
Most climate projections indicate that winter windstorms will increase slightly in number and intensity over the UK i.e., more winter storms, including disproportionately more severe storms. However, there is medium rather than high confidence in this projection because some climate models indicate differently.
Drought
Whilst there have been observed changes in the drivers of drought in the UK, there is much less evidence of trends in many drought metrics at present. However, the impact of extreme hot periods in summer has been noticeable in recent years (2018 and 2022) and shows the impact rising temperatures can have on water supply and demand.
Currently, there are no UK climate attribution studies available that clearly link human induced climate change with an altered risk of drought events. However, attribution studies have been carried out for extreme temperature events, which can lead to increases in evaporation, drier soil and considerable impacts on water supplies.
Most studies into our future climate point towards general increases in frequency and length of meteorological drought for the UK. This general rainfall deficit can exacerbate other forms of drought such as hydrological drought or agricultural drought, but these other forms of drought can have other drivers such as groundwater storage, drier soil and low river flows.
Extreme cold and snow
Despite the warming climate, extreme cold events still occur in the UK due to natural variability. The decrease in the frequency, duration, and intensity of these events over recent decades is clearly linked to the observed warming of the planet and can be attributed to human activity. For example, attribution studies have found that the unusually cold European winter of 2009/2010, UK cold snap in March 2018 (which included the event widely known as the Beast from the East) and the cold UK spring of 2013 would be much more likely without human influence on the climate.
The number of air and ground frost days in recent years has also decreased, with 4% fewer days of air frost in the most recent decade (2013-2022) than the 1991–2020 average, and 15% fewer than the 1961–1990 average. 2013-2022 also had 7% fewer days of ground frost than the 1991-2020 average and 24% fewer than the 1961-1990 average.
Future UK winter climate will still be variable year to year, so severely cold winters are still likely to occur – just less often – so it is important to remain resilient to severe winters when they do occur. Snow in the UK is very conditional on the setup of the weather; it is not just low temperatures that lead to snow. Overall, projections show that the frequency of snow events will decrease in the UK in future. There is less certainty about the intensity of future snow events due to more complex atmospheric interactions.
Tackling climate change
Mitigating against a changing climate by reducing greenhouse gas emissions is critical to limiting warming which would help us avoid the worst impacts of climate change. We also need to adapt to the climate changes we are already seeing and the changes that are expected in the coming decades to make sure we avoid the most significant impacts.
Action is required across all levels of society – to find out more about how you can make a difference, take a look at our Get Climate Ready webpages.
Follow the #GetClimateReady hashtag on X (formerly Twitter) to learn more about weather and climate extremes this month.
In an era defined by environmental uncertainty, the need to fortify our communities against the impacts of climate change has never been more pressing. Climate resilience – a term often heard in discussions surrounding climate action – refers to humanity’s capacity to adapt and withstand the adverse effects of climate change while maintaining essential functions and minimizing disruption to livelihoods and ecosystems.
But what exactly are climate resilience and climate solutions?
Understanding Climate Resilience: Climate resilience encompasses a spectrum of strategies aimed at softening the risks posed by climate change. It involves building robust infrastructure, implementing sustainable land-use practices, fostering community preparedness, and enhancing ecosystem resilience. Essentially, it’s about future-proofing societies and environments against the challenges of a changing climate.
Defining Climate Solutions: Climate solutions refer to the various interventions, technologies, and policies designed to address climate change and enhance resilience. These solutions span a wide range of sectors, from renewable energy and sustainable agriculture to disaster risk reduction and climate-smart infrastructure. By adopting and scaling up these solutions, society can partially adapt to climate impacts, and build a more sustainable future.
Case Studies: Met Office’s Climate Resilience Initiatives:
Climate Services for Developing Nations: The Met Office, in collaboration with international partners, provides climate services to developing nations to enhance their resilience to climate change. These services include tailored climate information, early warning systems for extreme weather events, and capacity-building initiatives to empower local communities to manage climate risks effectively. By equipping vulnerable regions with the tools and knowledge needed to anticipate and respond to climate impacts, the Met Office is helping build resilience on a global scale.
Climate Change Adaptation in Urban Environments: With rapid urbanisation and population growth, cities face unique challenges in the face of climate change. The Met Office is involved in research and development projects aimed at enhancing climate resilience in urban environments. This includes modelling future climate scenarios, assessing climate risks to infrastructure and communities, and developing adaptation strategies to bolster resilience. By integrating climate considerations into urban planning and infrastructure development, cities can better withstand the impacts of extreme weather events and changing climate patterns.
Enhancing Agricultural Resilience: Agriculture is particularly vulnerable to the impacts of climate change, with shifting weather patterns, extreme temperatures, and fluctuations in rainfall posing significant challenges to food security and livelihoods. The Met Office collaborates with agricultural stakeholders to consider climate-smart farming practices, improve crop forecasting capabilities, and provide climate information to farmers. By promoting sustainable agriculture and supporting adaptive measures, the Met Office is helping farmers build resilience to climate variability and ensure food security for future generations.
In conclusion, ‘resilience’ is not just a buzzword; it’s critical for safeguarding our planet and securing a sustainable future for all. By embracing climate solutions and investing in resilience-building initiatives, we can navigate the challenges of a changing climate and create a more resilient, equitable, and prosperous world for generations to come.
It will be no surprise for many to hear that April 2024 has been a wet month. In what has felt like an unsettled spring so far, the UK has had its sixth wettest April since the series began in 1836, according to provisional statistics from the Met Office.
Sunshine has been in short supply, with the UK provisionally recording just 79% of its long-term average for the month.
Wetter than average
The UK experienced 55% more rainfall than an average April, with 111.4mm falling across the month, making it the sixth wettest April in the series and the wettest April since 2012.
Many areas recorded more than their long-term average monthly rainfall, with Scotland experiencing its fourth wettest April in a series which started in 1836. It saw 148.9mm of rainfall across the month – more than 60% of its average and the wettest April since 1947.
Some places in Scotland saw more than double their average rainfall for the month. Edinburgh in particular saw very large rainfall totals, receiving 239% of its average April rainfall, which is its second wettest on record, falling only behind totals in 2000. East and West Lothian, Aberdeen, Clackmannan, Berwickshire and Cumbria, among others, also recorded more than double their average rainfall in the month. A rain-gauge at Honister Pass in the English Lake District recorded more than 400mm of rain.
Met Office Scientist Emily Carlisle said: “April has been a continuation of the past few months: often wet, windy and unsettled. April showers were present from the beginning of the month, with frontal systems bringing persistent precipitation across the UK. Although a high-pressure system moved over the UK on the 20th bringing some drier weather, by the end of the month, low pressure was back in charge, bringing with it more rain.”
Temperatures around average
April was a month of two halves when it comes to temperatures. The month started off warm, particularly along the southeast coast of England. Writtle in Essex recorded 21.8°C, making it the hottest day of 2024 so far in the UK.
Temperatures then dropped, remaining slightly below average for most of the last two weeks of April. This balanced out the warmer temperatures at the start of the month and resulted in a provisional average mean temperature of 8.3°C for the UK, only 0.4°C higher above the 1991-2020 long-term average.
Cloudy conditions often resulted in overnight temperatures being held up, with the average minimum temperature being above average (+0.8°C).
A dull month
Along with being a wet month, April has also been a dull month. The UK provisionally recorded 79% of the long-term average sunshine duration, with 122.9 hours.
One named storm
April saw Storm Kathleen arrive on the 6th, bringing heavy rain to Scotland, Wales, parts of Northern Ireland and the west coast of England. Kathleen also brought strong winds across the UK, with gales along coasts, particularly in the north and west of the UK. Kathleen was the eleventh named storm of the 2023/24 season. This is only the second time that the Met Office has reached the letter K since they began naming storms in 2015.
Spring so far…
Meteorological spring (March to May) so far has been wet. Both England and Wales have already seen more than their long-term average rainfall for the entirety of the season, while the UK has seen 96%. At this point in the season, we’d expect to see 66% of average.
Each year, from June-October, polar climate scientists from the Met Office produce a series of monthly sea ice briefings for the government and the general public. These briefings describe the state of Arctic and Antarctic sea ice, compare how these relate to historic patterns, and, where possible, assess causes of unusual behaviour.
Sea ice is frozen seawater that floats on the surface of the ocean and is found when temperatures are cold enough for sea water to freeze. The extent of sea ice is a key climate indicator, because sea ice cover insulates the ocean in winter and reflects sunlight in summer, as well as providing a habitat for a range of species.
Here, Senior Scientist Alex West talks about the 2023 Antarctic sea ice minimum and its interaction with the ocean and atmosphere.
Lowest sea ice extent on record
Antarctic average sea ice extent for 2023 was the lowest on record. During the ice growth season from June-October, ice extent was exceptionally low for the time of year, reaching over 1 million square km below previous record lows and setting a new record low maximum extent by a very large margin. For much of the rest of the year, the ice was at record or near-record low levels, recording a second successive record low minimum in February (Figure 1).
Figure 1. Antarctic sea ice extent in 2023 (bold black line) with other recent years indicated, as well as earlier years with notably low sea ice extent. The 1981-2010 average is also shown, with the shaded region indicating 2 standard deviation intervals.
The very low extent from June-October was partly caused by enhanced warm northerly winds, associated with persistent areas of high and low pressure (Ionita, 2024). Early in the ice growth season, from May-July, these were concentrated near the Antarctic Peninsula, in the Weddell and Bellingshausen Sea regions; later in the growth season, from August-October, the strongest winds were to be found further west, in the Ross Sea. The position of the lowest sea ice conditions changed similarly.
However, it is likely that the ocean also played a part. The low extent of 2023 continues a pattern of very high variability in Antarctic sea ice since 2007, with first high and then low sea ice conditions persisting for long periods of time, in a way unlikely to be caused by known atmospheric changes (Hobbs et al., 2024). A key moment in this period of high variability was a large reduction that occurred in 2016, and this is thought to be linked to changes in the upper ocean caused by stronger westerly winds mixing warmer waters below towards the surface (Earys et al., 2021; Zhang et al., 2022). Further mixing of warm waters cannot be ruled out as an additional cause of the very low extent of 2023.
The precise contribution of anthropogenic (human-caused) global warming to the record low sea ice of 2023 is not yet known. While climate models predict that Antarctic sea ice extent will decrease in response to anthropogenic warming, variability in the past 15 years has been considerable, with very high extent from 2012-2014 followed by the current period of very low extent (Figure 2). Further extreme variability in either direction remains possible in the years ahead.
Figure 2. Antarctic sea ice monthly anomalies over the period of satellite observations. For each month, the 1981-2010 average ice extent for that month is subtracted. This largely removes the seasonal cycle so that subtler long-term changes can be viewed more easily.
During April we are exploring the topic of the ocean and climate. Follow the #GetClimateReady hashtag on X (formerly Twitter) to learn more throughout the month.
References
Eayrs, C., X. Li, M.N. Raphael and D.M. Holland (2021) Rapid decline in Antarctic sea ice in recent years hints at future change. Nat. Geosci., 14, 460–464. https://doi.org/10.1038/s41561-021-00768-3
Hobbs, W., and Coauthors (2024): Observational Evidence for a Regime Shift in Summer Antarctic Sea Ice. J. Climate, 37, 2263–2275, https://doi.org/10.1175/JCLI-D-23-0479.1
Ionita M (2024) Large-scale drivers of the exceptionally low winter Antarctic sea ice extent in 2023. Front. Earth Sci. 12:1333706, https://doi.org/10.3389/feart.2024.1333706
Zhang, L., T.L. Delworth, X. Yang, F. Zeng, F. Lu, Y. Morioka and M. Bushuk (2022) The relative role of the subsurface Southern Ocean in driving negative Antarctic Sea ice extent anomalies in 2016–2021. Commun. Earth Environ., 3, 302. https://doi.org/10.1038/s43247-022-00624-1
A map of Antarctica showing the Antarctic Peninsula separated by the Bellingshausen and Weddell Seas. Map: Adobe Stock.